Example: Confidence Interval Calculations
This example shows the procedure for obtaining the 95% Confidence Interval for kinetic parameters that are estimated.
You may import the MTO-Example.rex file from the Optience Corporation\REX Suite\REX Examples folder. This file is a simplified model for the Methanol to Olefins (MTO) reaction system, that consists in two main group of reactions:
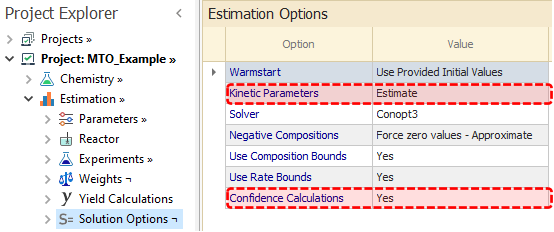
To enable the Confidence Interval calculation for the kinetic parameters, the Estimate feature must be turned on for the kinetic parameters in the Solution Options node, and the Confidence Calculations option should be set to Yes, as shown below:
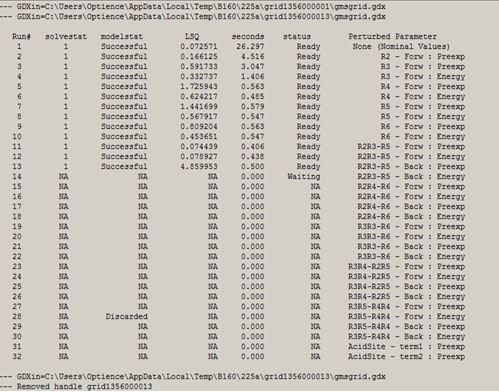
On executing the run, the progress of the calculations is shown as seen in this image:
The columns in the progress report are described below:
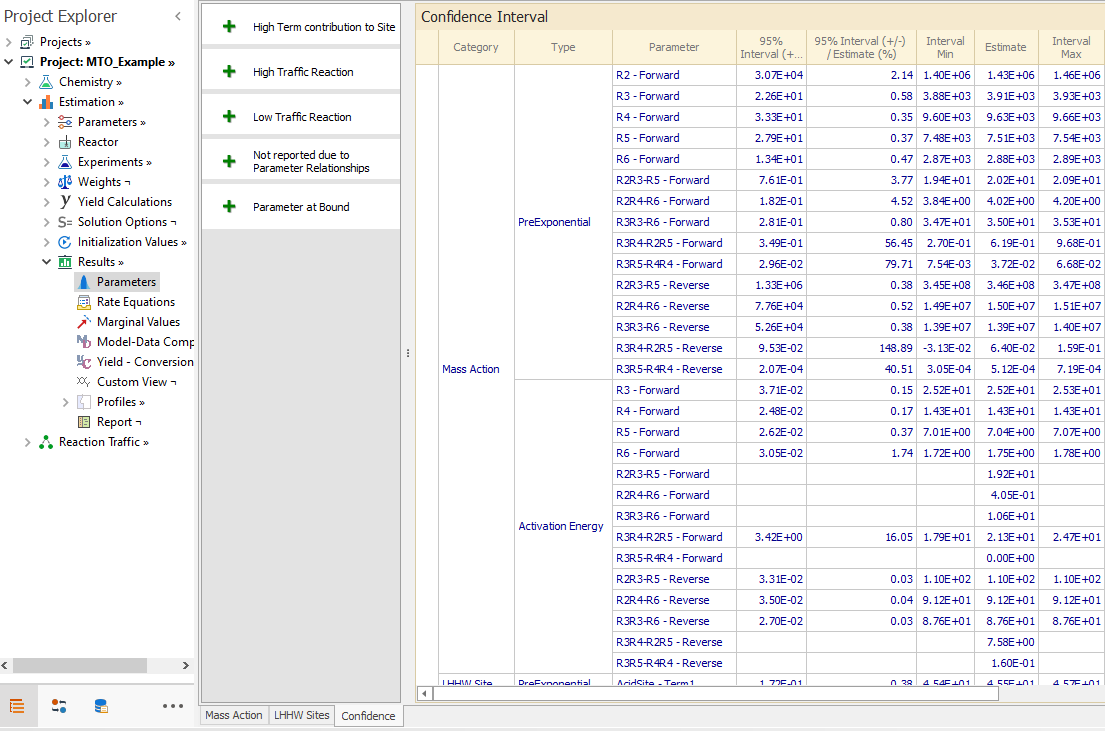
The confidence interval values obtained are shown in Results → Parameters node, in the Confidence tab:
In this example, there are reactions and LHHW Sites selected as Estimate in Estimation node. Thus, both Mass Action and LHHW Sites are shown in the Confidence tab as separate categories. All parameters that are being estimated and have open bounds are listed, with the information organized in columns as follows:
You may import the MTO-Example.rex file from the Optience Corporation\REX Suite\REX Examples folder. This file is a simplified model for the Methanol to Olefins (MTO) reaction system, that consists in two main group of reactions:
- Methylations: Irreversible reactions where methanol (MeOH) addition produce longer olefins:
-
R2: 2*MeOH ⇒ ETY + 2*H2O Ethylene formation
R3: MeOH + ETY ⇒ PPY + H2O Propylene formation
R4: MeOH + PPY ⇒ BTE + H2O Butene formation
R5: MeOH + BTE ⇒ PTE + H2O Pentene formation
R6: MeOH + PTE ⇒ HXE + H2O Hexene formation
- Scissions: Reversible reactions where olefins react by merging or splitting :
-
R2R2-R4: 2*ETY ⇔ BTE
R2R3-R5: ETY + PPY ⇔ PTE
R2R4-R6: ETY + BTE ⇔ HXE
R3R3-R6: 2*PPY ⇔ HXE
R3R4-R2R5: PPY + BTE ⇔ ETY + PTE
R3R5-R4R4: PPY + PTE ⇔ 2*BTE
To enable the Confidence Interval calculation for the kinetic parameters, the Estimate feature must be turned on for the kinetic parameters in the Solution Options node, and the Confidence Calculations option should be set to Yes, as shown below:
|
|---|
On executing the run, the progress of the calculations is shown as seen in this image:
|
|---|
The columns in the progress report are described below:
- Run# column lists all the runs to be done during the Confidence Interval calculations:
- Run1 is the Estimation run where the kinetics parameters are estimated by reconciling the selected measurements. This run is same as the typical estimation run and is not related to the confidence calculations.
If this run is successful, the parameter solution found is used for the following simulation runs which are needed for the confidence calculations. - Run2, Run3....RunN are simulations done with all kinetic parameters fixed to the solution from Run1, except for one parameter that is perturbed from its optimal value. The magnitude of the perturbation is specified in Solution Options node.
The Perturbed Parameter column indicates the parameter being perturbed to get the sensitivity information.
All these runs correspond to parameters with open bounds belonging to Reactions or LHHW Sites that are selected as Estimate in the Estimation node. If an estimated parameter lies at either its lower or upper bound, the confidence interval for that parameter is not calculated.
- Run1 is the Estimation run where the kinetics parameters are estimated by reconciling the selected measurements. This run is same as the typical estimation run and is not related to the confidence calculations.
- Solvestat column shows the solver status of the each run:
- NA: if the run was not done yet.
- 1: Normal completion, meaning that the solver terminated without any problems.
- 2: Iteration Interrupted. This means that the solver was interrupted because it used too many iterations. You may increase the Iteration Limit option in the Solution Options node.
- 3: Resource Interrupt. This means that the solver was interrupted because it used too much time. You may increase the CPU Time Limit option in the Solution Options node.
- From 4 to 6 and from 8 to 13: The solver was unable to converge the model due to internal failures.
- 7: Licensing problems.
- Modelstat column indicates the model status of the each run:
- NA: if the run was not done yet.
- Successful.
- Discarded: this may appear if the parameter involved has a solution at its bound. The simulation is not needed and hence not done.
- Fail: a feasible solution could not be found for the model.
- LSQ is the value of the weighted least square error of the run.
- seconds is the time in seconds needed to complete each run.
- status is related to the runs queue:
- NA: if the run was not done yet.
- Waiting: the run is underway
- Ready: the run is finished.
- Fail: a feasible solution could not be found for the model.
- Perturbed Parameter indicates the parameter that is being perturbed.
The confidence interval values obtained are shown in Results → Parameters node, in the Confidence tab:
|
|---|
In this example, there are reactions and LHHW Sites selected as Estimate in Estimation node. Thus, both Mass Action and LHHW Sites are shown in the Confidence tab as separate categories. All parameters that are being estimated and have open bounds are listed, with the information organized in columns as follows:
- Type column groups parameters based on their type: Preexponential, Activation Energy and Orders.
- Parameter column. For Mass Action, this indicates the Reaction-Direction pair that the parameter belongs to. For LHHW Site, it indicates the Site-Term pair that corresponds to the parameter.
- 95% Interval (+/-) column displays a zone (z) around the estimated parameter value. The units are the same as the parameter.
There is 95% Confidence that the mean parameter value lies within (+/-) z units of the estimated value.
- 95% Interval (+/-) / Estimate (%) column indicates (in percentage terms) the width of the confidence interval relative the estimated parameter value. The values here are independent of the parameter units, so can be compared with other parameters for ranking purposes.
- Interval Min is the lower bound of the confidence interval.
- Estimate is parameter value, as estimated in Run# 1.
- Interval Max is the upper bound of the confidence interval.
- Description column highlights important information about the parameter:
- High Traffic Reaction can appear in the Mass Action tab, and indicates that the parameter belongs to a reaction-direction pair whose molar traffic is at least 25% of the maximum traffic in the reaction network.
The traffic can be visualized in Reaction Traffic node. In general, you may care more about the confidence interval for high traffic reactions than the lower traffic reactions. - Low Traffic Reaction can appear in the Mass Action tab, indicating that the parameter belongs to a reaction-direction pair whose molar traffic is less than 0.5% of the maximum traffic in the reaction network.
- High Term contribution to Site can appear in the LHHW Sites tab, indicating that the parameter belongs to a term whose values are in average at least 25% of the total site value.
- Low Term contribution to Site can appear in the LHHW Sites tab, when the parameter belongs to a term whose values are in average smaller than 0.1% of the related Site values.
- Simulation Infeasible: the simulation done after perturbing the parameter was not successful.
You may try to reduce the related perturbation in Solution Options node and then run again to see if a feasible solution can be found.
- Parameter at Bound is shown when the estimated value is at either the lower or upper bound. Confidence interval calculation can not be done for parameters at bounds.
- Parameter not affecting LSQ implies that the perturbation of the parameter does not change the Prediction Error (LSQ), consequently no confidence interval is reported. Uncertainty in a parameter that does not affect the prediction error is unknown.
- Not reported due to Relationships is shown when the parameter is involved in one or more active Relationships. When two or more parameters are tied by active Relationships, each relationship is designated to constrain a chosen parameter to a fixed value, and the above message is shown because the confidence interval calculations are not done for this parameter. In general, the number of parameters for which the above message is shown should equal the number of active relationships as long as all estimated parameters are not at bounds.
- High Traffic Reaction can appear in the Mass Action tab, and indicates that the parameter belongs to a reaction-direction pair whose molar traffic is at least 25% of the maximum traffic in the reaction network.
Top of Topic
Go back to: